Custom Drawing Tools

View as Markdown

Build Custom Drawing Tools

Custom Drawing Tools allow us to easily create and share custom user-defined drawing tools for use in the Trader application. Defining a custom drawing tool is very similar to defining a custom indicator. We need to create an object that obeys the DrawingToolImplementation interface, as well as export an object that obeys the DrawingTool interface. Let’s look at each:

1const MyLine = {
2 //...DrawingToolImplementation methods go in here.
3}
4
5module.exports = {
6 name: 'ThreePointTool', //a unique identifier for the tool
7 description: 'Three Point Tool', //the UI displayed name of the tool
8 drawing: MyLine, //the object that implements DrawingToolImplementation
9 params: { //like indicators, these are user defined parameters
10 maxPeriod: predef.paramSpecs.period(14)
11 },
12 tags: ['My Tools'], //a way to group drawing tools in the UI
13 minN: 2, //the minimum number of anchors
14 maxN: 2 //the maximum number of anchors
15}

We can see from this example how to define a Custom Drawing Tool at the module.exports level - we need at least the name and drawing fields. The most important field is the drawing. This is where we define our DrawingToolImplementation methods. Let’s explore those methods now.’

1const MyLine = {
2 //initializes the `state` parameter of the Drawing Tool.
3 init() {
4 return {/*any arbitrary state, this doesn't even have to be an object*/}
5 },
6
7 //graphic items to render associated with this Drawing Tool. The parameter object is
8 //available to all of the DrawingToolImplementation functions.
9 render({anchors, props, state, plots}) {
10 return {
11 items: [ /* we can put DisplayObjects in here */ ]
12 }
13 },
14
15 //we can change our state parameter using update. A common use case would be to perform a big calculation
16 //and store it in state only when necessary to improve performance and decrease resource usage.
17 update({anchors, props, state, plots}) {
18 if(someCondition) {
19 return { newState: { value: 'myNewValue' } }
20 }
21 },
22
23 //holding the SHIFT key over a drawing reveals its tooltip. We can determine how
24 //the tooltips render with the toopltips function
25 tooltips({anchors, props, state, plots}) {
26 return [
27 //DrawingTooltip items go here
28 ]
29 },
30
31 //controls the X and Y coordinate space that is valid for the anchor at the matching position in the array.
32 //anchors[0] will be allowed to move 10 units in the X axis, anchors[1] will be able to move 5 units in the Y axis.
33 //If there is no X or Y value listed, there will be no restraint placed on the anchor's valid coords.
34 anchorRestraints() {
35 return [
36 {/*zeroth position anchor*/x: 10 },
37 {/*first position anchor*/y: 5 }
38 ]
39 },
40
41 //controls the color of each anchor at the matching position in the array.
42 //anchors beyond the index accounted for in this array will default to the tail color,
43 //in this case 'blue'
44 anchorStyles() {
45 return [
46 {/*zeroth position anchor*/color: 'red' },
47 {/*first position anchor*/color: 'blue' },
48 ]
49 }
50}

You can see that each of these functions controls some aspect of the tool. Let’s do something simple and draw a line between two points using the render function.

1const MyLine = {
2 render({anchors}) {
3 return {
4 items: [
5 {
6 tag: 'LineSegments',
7 key: 'line',
8 lines: [
9 {
10 tag: 'Line',
11 a: anchors[0],
12 b: anchors[1]
13 }
14 ],
15 lineStyle: {
16 lineWidth: 2,
17 color: '#0f0'
18 }
19 }
20 ]
21 }
22 },
23}

Now if we choose ‘My Line’ from the drawing tools selector, we should be able to draw a line between two points.

A line from point anchors[0] to point anchors[1]

This is a very simple line drawing tool. Let’s take it a step further and add a tooltip. When viewing a Drawing Tool that you’ve drawn onto a chart, you may mouse over it holding the SHIFT key to reveal its tooltip. If you don’t define tooltip behavior, nothing will happen. Let’s make a tooltip that renders some text and a special delta object.

1const MyLine = {
2 //...
3 tooltips({anchors}) {
4 //returns an array of DrawingTooltip items
5 return [
6 {
7 coord: anchors[0], //coord tells the tooltip where to render in chart space. An anchor's point is a typical choice
8 alignment: { //the alignment tells the tooltip how to align itself
9 tag: 'predef',
10 x: 'left',
11 y: 'above'
12 },
13 items: [
14 {
15 content: "My Line",
16 },
17 {
18 content: {
19 delta: anchors[1].y.value - anchors[0].y.value
20 }
21 }
22 ]
23 }
24 ]
25 }
26 //...
27}

When we hold SHIFT over our drawing now, it will display ‘My Line’ and the tick delta information between the two points anchors[0] and anchors[1]. Try moving it around to see how it changes.
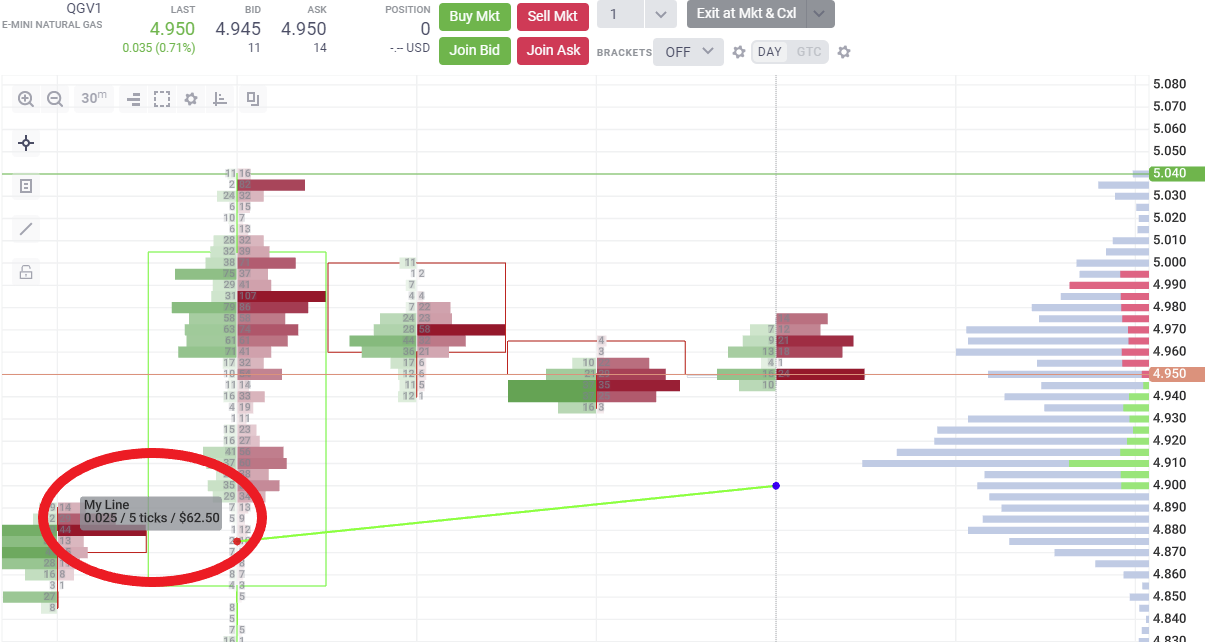
The tooltip showing the delta between the two points.