
Spectrogram
Indicator Tutorial 10
Our Spectrogram has a lot in common with our previous indicator. Let’s move out such pieces to a new helper module:
Let’s save it with the fourierCommon.js name.
Refactored fourierMA will be reduced up to the next version:
The Spectrogram indicator will use the same approach to calculate Fourier coefficients. Then, we will build a custom plotter that will show these coefficients as 2D map of frequencies and their amplitudes.
Because there are no regular plots and the app can struggle to evaluate min/max values of indicator to properly auto-scale it in the area, we implemented Indicator.scaler field in the module’s export. It will tell the app to use two fields from the output for scaling, even if they are not plotted.
The same lower and upper fields are used as domain boundaries for the heatmap object. Each column of the heatmap is a list of colors that divides a space between lower and upper to equal pieces.
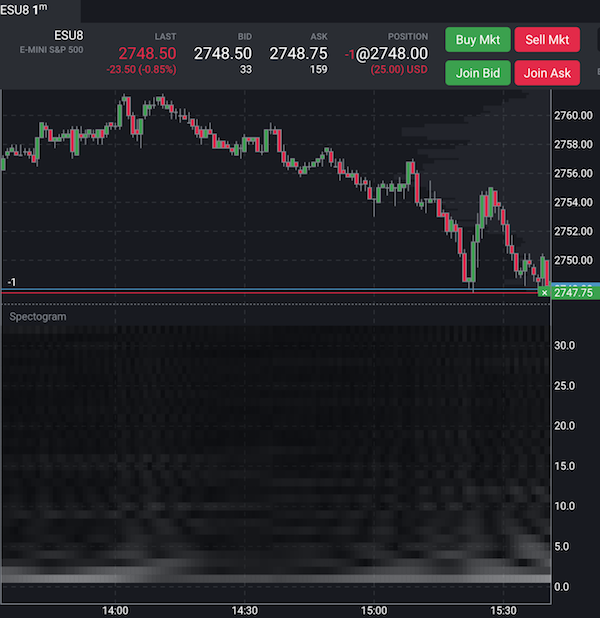
Note: vertical axis shows frequency as a divider of the period of the indicator. For example, 1 corresponds to the whole period, 2 - twice faster than indicator’s period, etc.