Graphics
Indicator Tutorial 11
Custom Indicators now has a Graphics module. We can leverage this in our own indicators to create more complex graphics.
To enable graphics in your indicator, modify the object return value of map.
The items field within graphics tells the renderer what graphics to display. Each item must adhere to the GraphicsObject interface.
Let’s imagine we want to note when a substantial gain has occured at an index on the chart. To do so we must track the last known value. Let’s write a tool to help us do this:
On push, the tracker tool will compare the difference of incoming value and the last known value against a magicNumber that will be set by
UI parameters. The push function will return true if the difference is greater than or equal to the magic number, indicating a ‘substantial gain’,
as defined by the end user. We will use boolean result to determine whether or not to render a graphic at the point of ‘substantial gain’.
Now let’s build our calculator - the class that will ultimately represent our indicator.
We first must initialize our tracker tool. We do so in the init function of our calculator, leveraging our module’s props.
In the map function, we use our tracker tool to get a boolean value for the bar currently being drawn. Finally in the return
object of our map, we can add our first graphics item. This particular object is a Text object. If we were to select
our Substantial Gains indicator and supply it with a (reasonable) magic number, we should see some greenish exclamation points
rendered over some of our chart’s bars.
That’s a great start, but we have substantially more power at our disposal. Let’s start by
making our graphic a bit more complex. Within our items array, let’s add another GraphicsObject.
This is another type of GraphicsObject, the ContourShapes type. This object describes one or more Shape
objects to apply a border stroke to, as defined by its lineStyle field. Now we should see a circled exclamation point on bars that have
had ‘substantial gains’. Now that we have more than one logically grouped element, we should consider containing them as a unit. To do so,
we can use the Container type. Replace your items code with this single GraphicsObject object.
The container has one unique field, children, which is an array of GraphicsObjects. You can leverage this
grouping to apply transformations that keep these contained objects in relative space. That way you can move the whole
container instead of each object. The other benefit of this is that we can leverage VisibilityConditions over
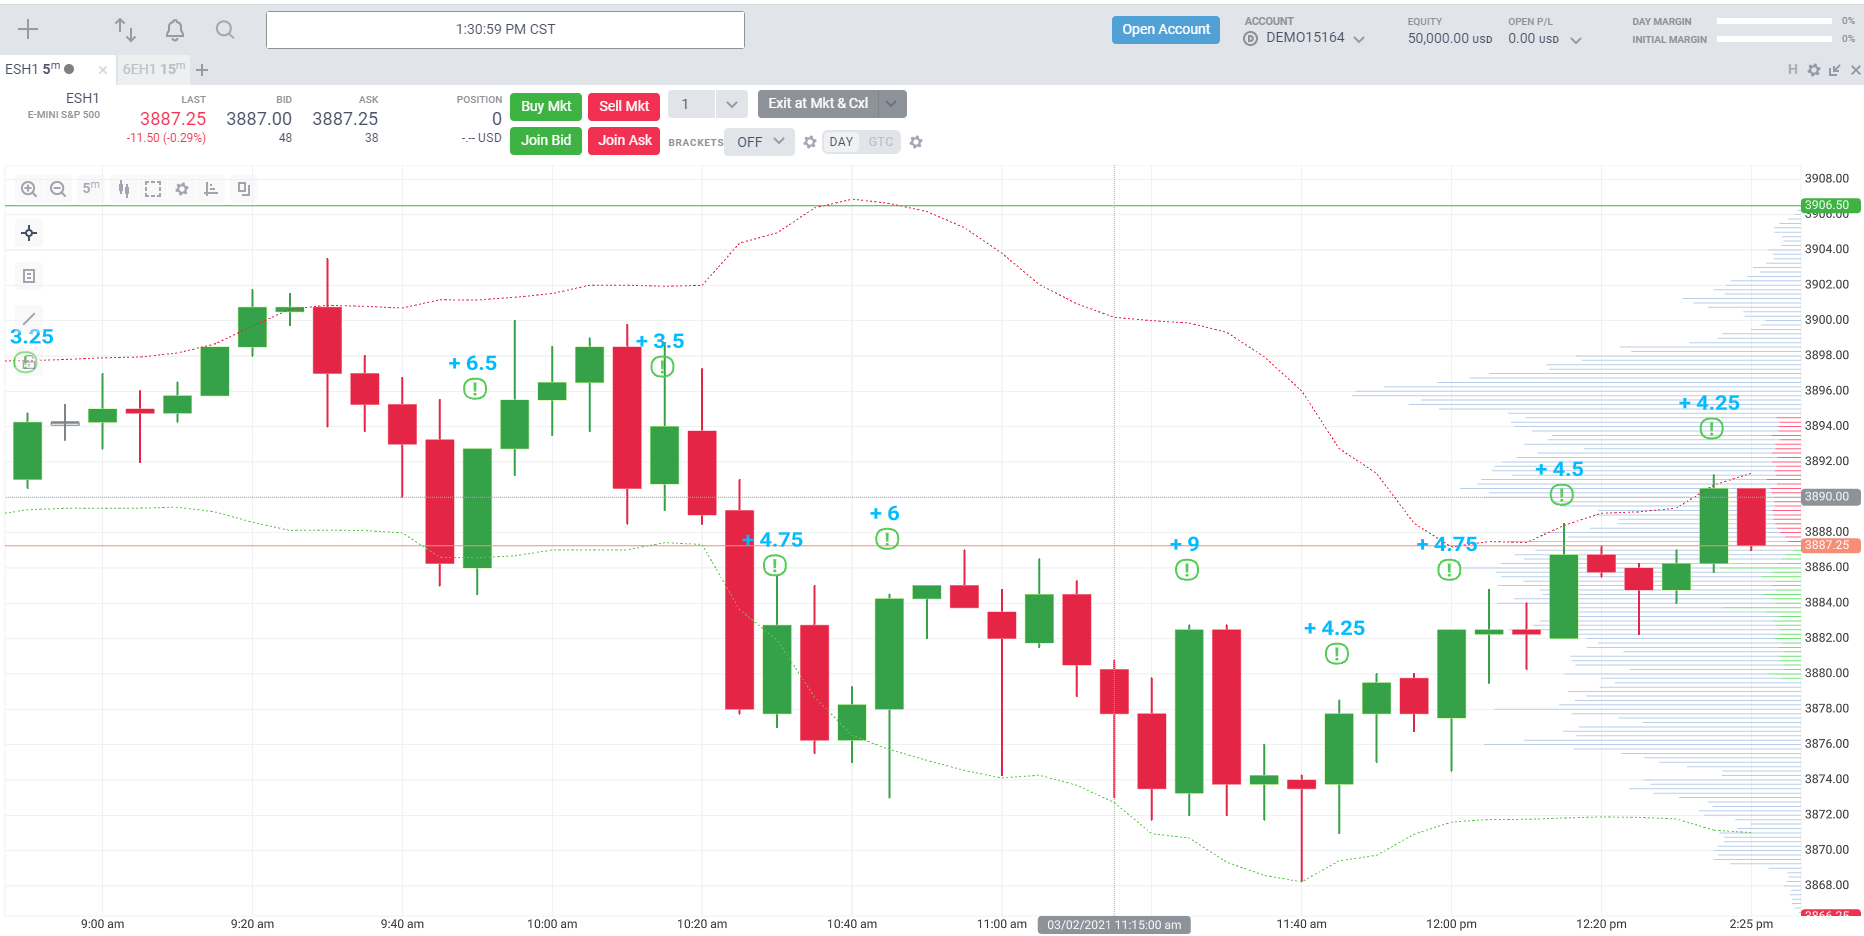
whole groups. Here’s what we should see when we render this indicator:
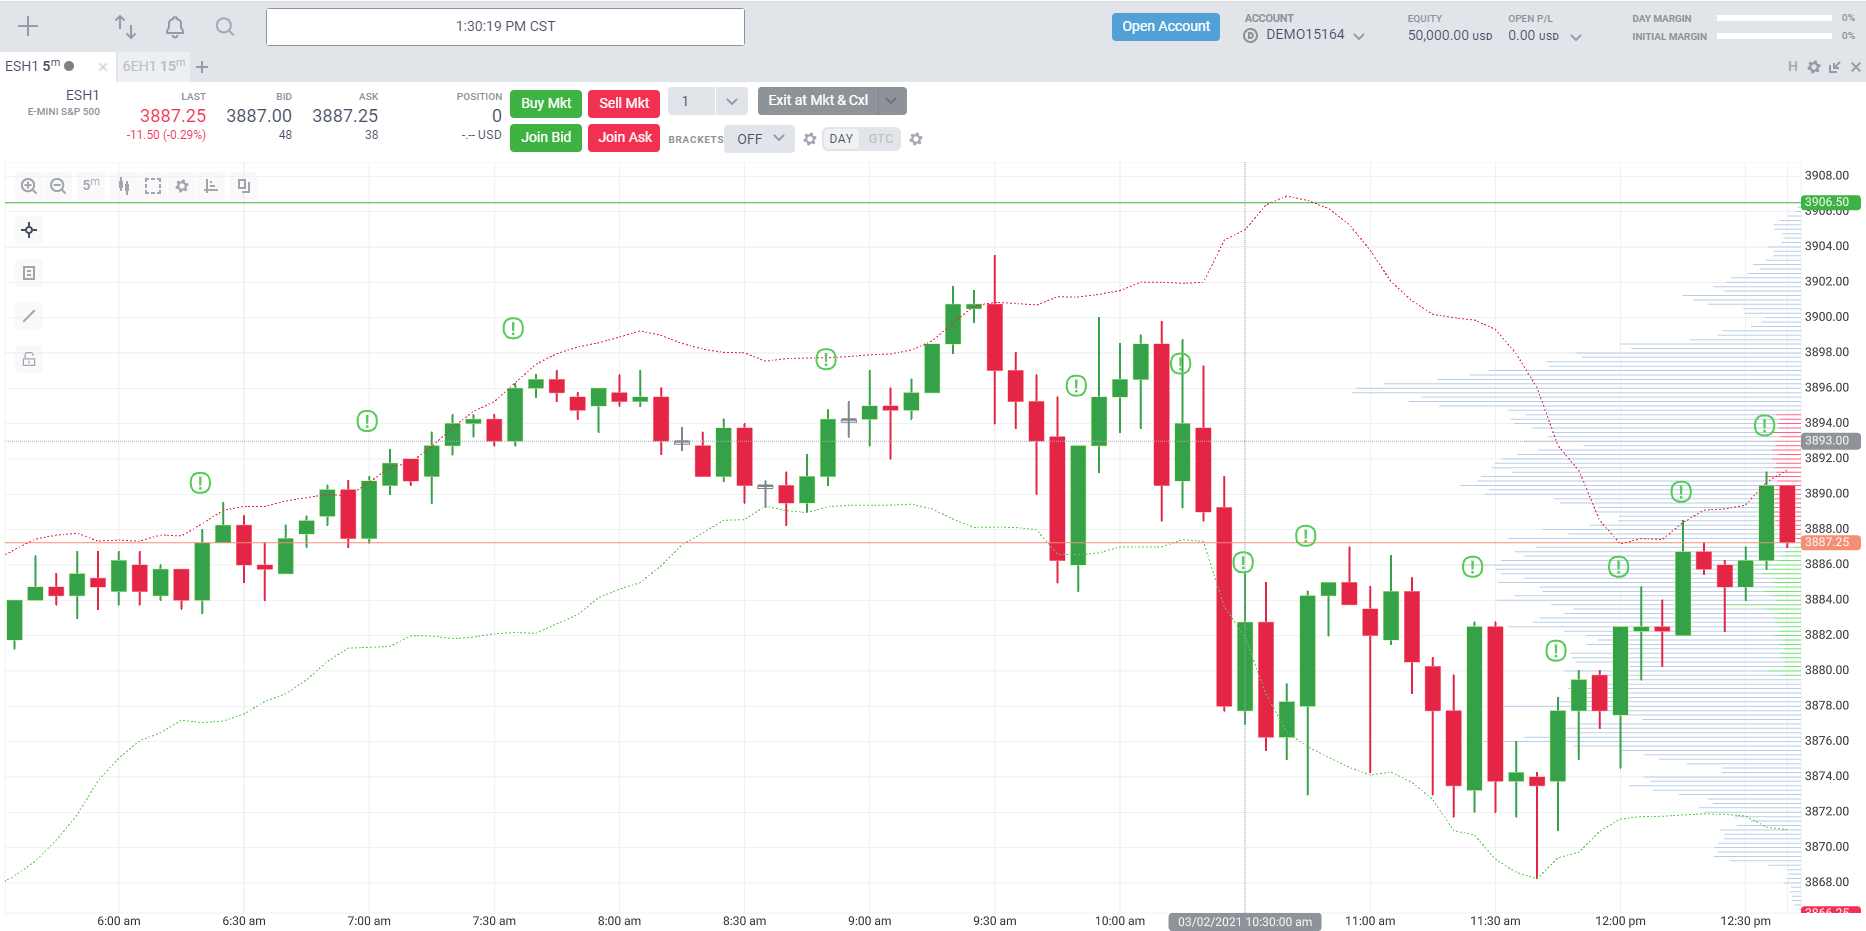
To understand our next step, let’s do an experiment. First, zoom way out in the X axis - you can do so by scrolling the
mouse wheel. Those circled exclamations don’t scale down to fit the new bar size, instead they get clumped up and look bad.
Now zoom way in on the X axis. Now because we haven’t scaled up they look somewhat lacking and small. We can fix all of this
by creating a variety of groups to describe each breakpoint and give them a conditions field. These are the
VisibilityConditions} for the object being rendered.
VisibilityConditions consist of scalar ranges in the X or Y axis. These are measured in pixels-per-domain-unit. This works out to roughly the pixel distance between bars in the X axis, and the tick-size in pixels of an index for the given contract being calculated. What this allows us to do is render something different based on breakpoints we define. Here’s an example:
Now when the bars are tiny, and have only between 0 and 10 pixels between them, we will render a tiny dot instead of the circled exclamation.
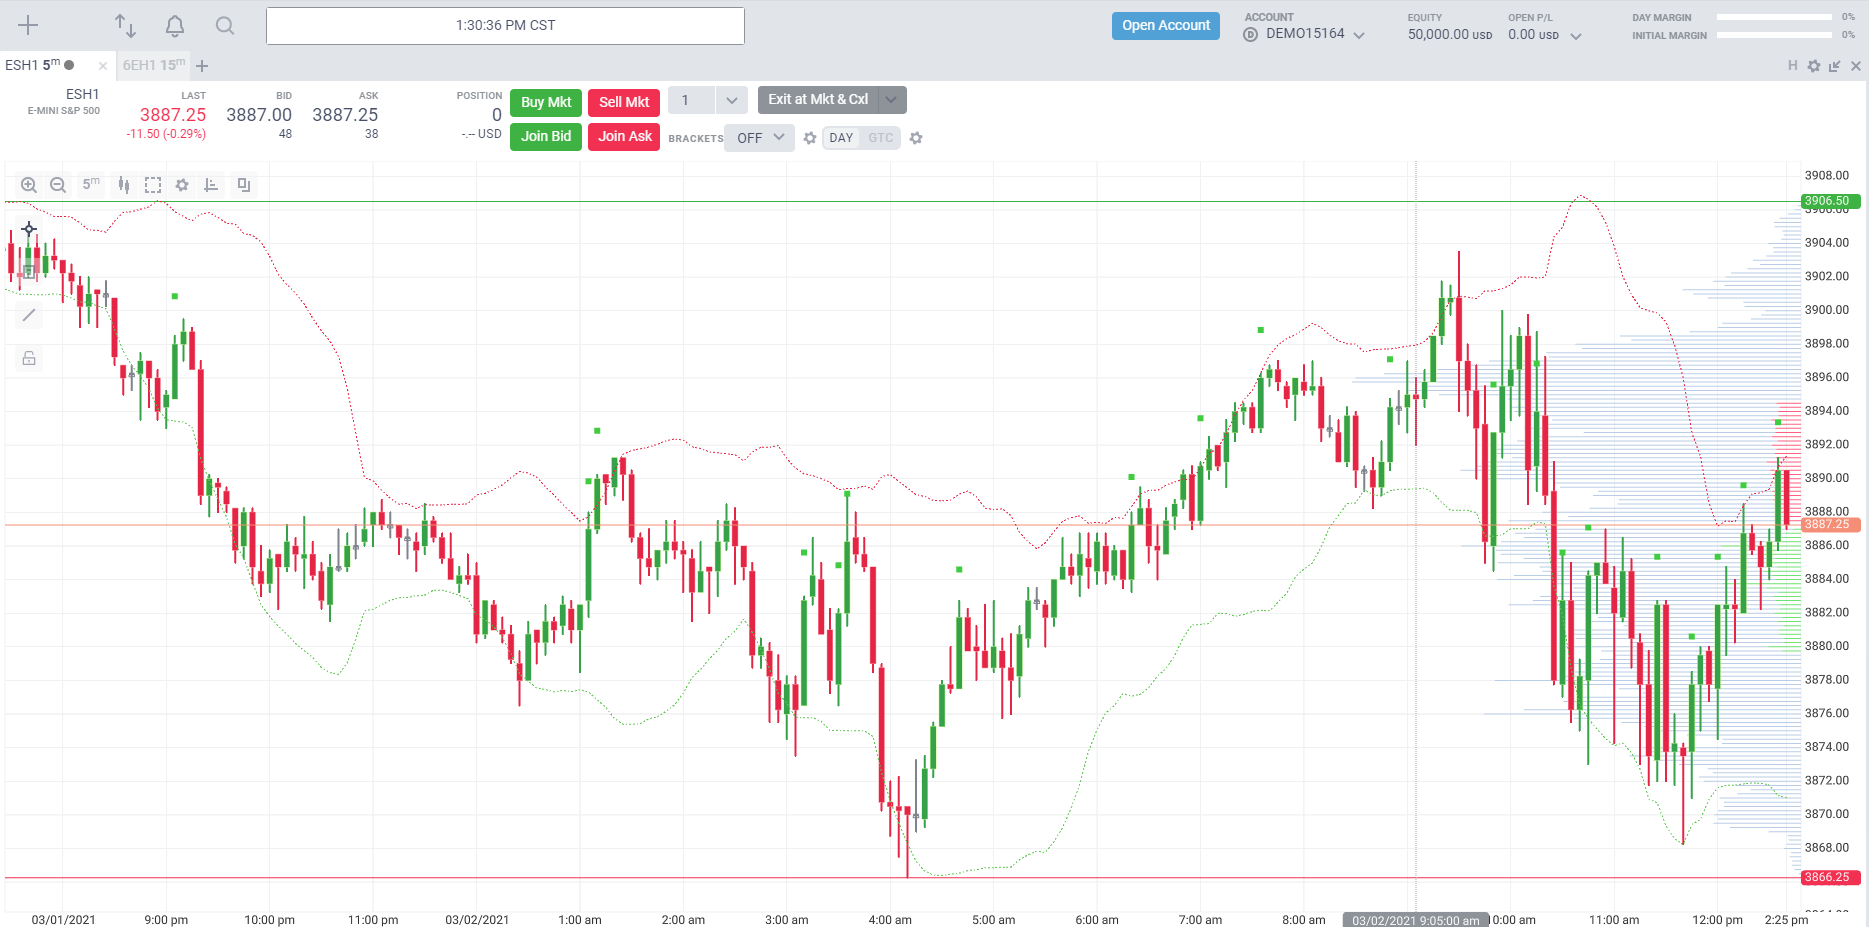
This introduces anotherGraphicsObject as well - the Dots object. It describes one or more WebGL
dots to render. At 10 pixels of space per bar or greater we draw our standard circled exclamation. Note that the scaleRangeX,
scaleRangeY, and their min and max fields are actually optional. If omitted, we simply won’t apply a bound in the ignored
direction or on the ignored axis. We can of course apply something extra for large pixel distances as well.
I’d like to display the amount of the ‘substantial gain’ at high pixel-per-domain-unit distances. We will need to modify our tracker
slightly to accomodate this - we currently discard our last value on each push. We will could provide the difference in the two values as
part of the return value of our tracker’s push function.
Rendering our indicator should yield this result at big pixel-to-domain ratios: