
CanvasLeft
Definition
Indicates the x-coordinate (in pixels) of the beginning of the chart canvas area.
Property Value
A double representing the beginning of the chart canvas area.
Syntax
\<chartcontrol\>.CanvasLeft
Examples
Based on the image below, CanvasLeft reveals that the chart canvas area begins at x-coordinate 53.
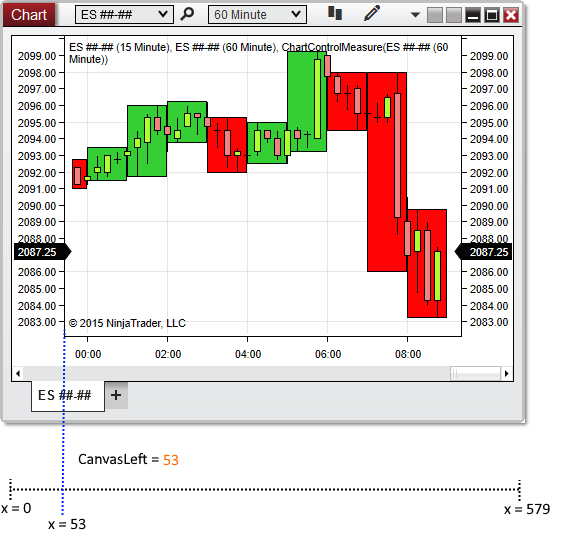
When no data series are left-aligned on a chart, CanvasLeft will return 0, representing the x-coordinate origin, because the chart canvas will begin at coordinate 0.