MaxValue
Definition
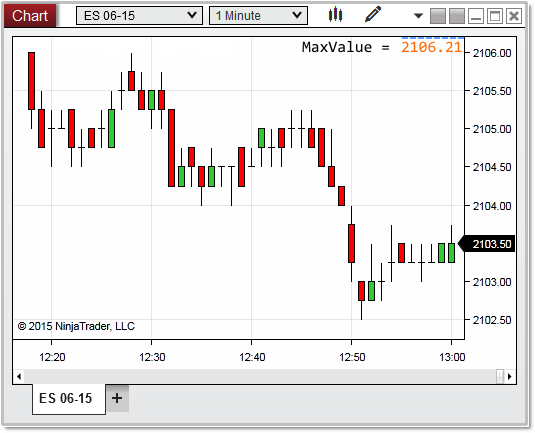
The highest displayed value on the chart scale.
Property Value
A double value representing highest value on the chart scale as a y value.
Syntax
\<chartscale\>.MaxValue
Examples
In the image below, the highest value displayed as text on the y-axis reads 2106.00, however as you can see, there are a few pixels on the chart scale above this tick. The absolute rendered MaxValue on the chart scale is calculated as 2106.21.