ChartScale
The ChartScale class includes a range of properties related to the Y-Axis values of the ChartPanel on which the calling script resides. The ChartScale can be configured to Right, Left, or Overlay.
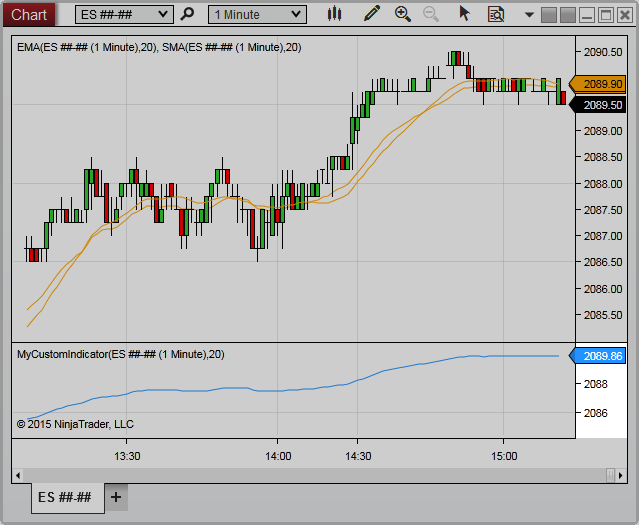

The ChartScale class includes a range of properties related to the Y-Axis values of the ChartPanel on which the calling script resides. The ChartScale can be configured to Right, Left, or Overlay.
| Method/Property | Description |
|---|---|
| GetPixelsForDistance() | Returns the number of device pixels between the value passed to the method representing a series point value on the chart scale |
| GetValueByY() | Returns the series value on the chart scale determined by a y pixel coordinate on the chart |
| GetValueByYWpf() | Returns the series value on the chart scale determined by a WPF coordinate on the chart |
| GetYByValue() | Returns the chart’s y-pixel coordinate on the chart determined by a series value represented on the chart scale |
| GetYByValueWpf() | Returns a WPF coordinate on the chart determined by a series value represented on the chart scale |
| Height | Indicates the overall distance (from top to bottom) of the chart scale in device pixels |
| IsVisible | Indicates if the chart scale is viewable on the UI |
| MaxMinusMin | The difference between the chart scale’s MaxValue and MinValue represented as a y value |
| MaxValue | The highest displayed value on the chart scale |
| MinValue | The lowest rendered value on the chart scale |
| PanelIndex | The panel on which the chart scale resides |
| Properties | Represents a number of properties available to the Chart Scale which can be configured to change the appearance of the scale |
| ScaleJustification | Indicates the location of the chart scale relative to the chart control |
| Width | Indicates the overall distance (from left to right) of the chart scale in device pixels |