IsYAxisDisplayedOverlay
Definition
Indicates an object on the chart is using the Overlay scale justification.
Property Value
A boolean value. When True, indicates that one or more objects on the chart are using the Overlay scale justification; otherwise False.
Syntax
\<chartcontrol\>.IsYAxisDisplayedOverlay
Examples
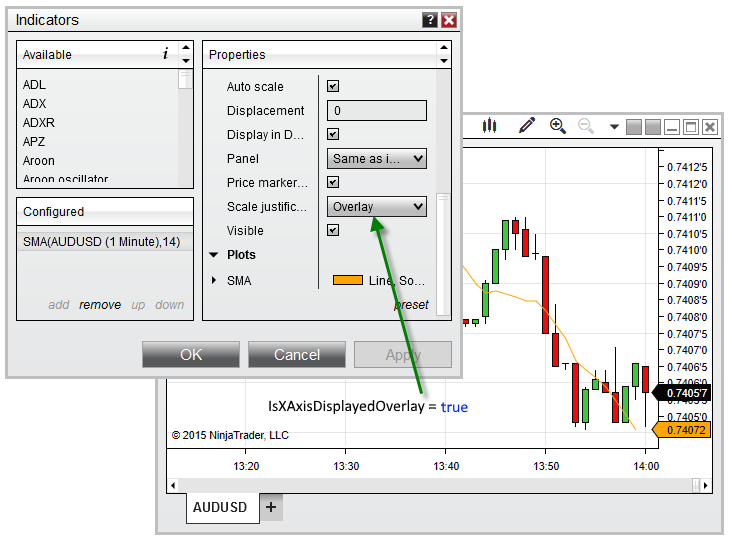
Based on the image below, IsYAxisDisplayedOverlay confirms that an object on the chart, in this case an SMA indicator, is using the Overlay scale justification.