MaxMinusMin
Definition
The difference between the chart scale’s MaxValue and MinValue represented as a y value.
Property Value
A double value representing the difference in scale as a y value.
Syntax
\<chartscale\>.MaxMinusMin
Examples
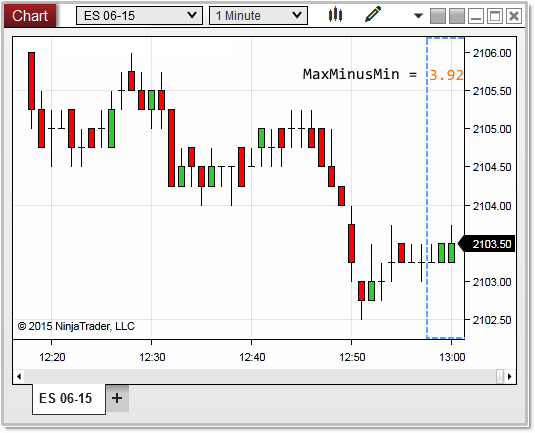
In the image below, the highest calculated value on the chart scale is 2106.21, with the lowest value being 2102.29; the MaxMinusMin property therefore provides us calculated value of 3.92.