
Properties
Definition
Represents various ChartBar properties configured from the Chart’s Data Series menu.
The properties on this page indicate what have been configured by the user, and is NOT necessarily representative of what is actually contained on the chart. For example, a user may have requested 120 days of chart data; however, only 60 days of bar data are actually returned from their provider.
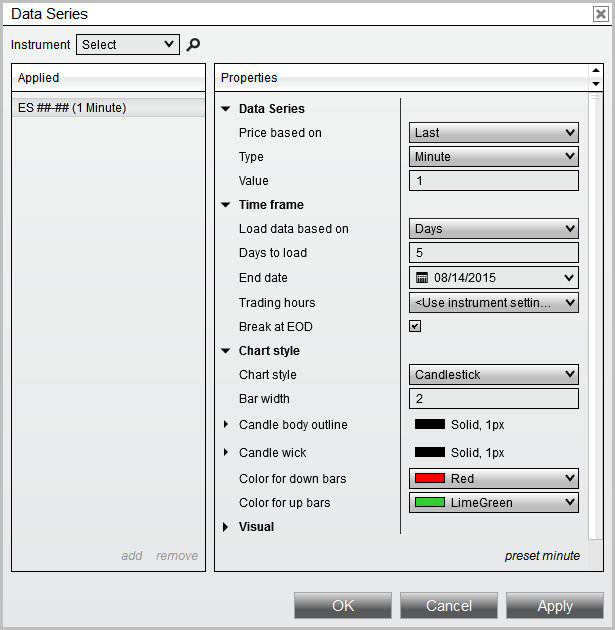
These are UI properties which are designed to be set by a user. Attempting to modify these values through a custom script is NOT guaranteed to take effect.
Properties
| Property | Description |
|---|---|
| AutoScale | A bool indicating if the Chart Data Series participates in the chart’s auto scaling methods |
| BarsBack | An int representing the Chart’s Data Series configured “Bars to load” when the RangeType.Bars is selected |
| BarsPeriod | The BarsPeriod object configured for Chart’s Data Series |
| CenterPriceOnScale | A bool indicating if the Chart’s Data Series should center the last traded price on the chart scale |
| ChartStyle | The ChartStyle object configured for the Chart’s Data Series |
| ChartStyleType | A ChartStyleType enum indicating the type of chart style configured. System defaults include: ChartStyleType.Box ChartStyleType.CandleStick ChartStyleType.LineOnClose ChartStyleType.OHLC ChartStyleType.PointAndFigure ChartStyleType.KagiLine ChartStyleType.OpenClose ChartStyleType.Mountain |
| DaysBack | An int representing the Chart’s Data Series configured “Days to load” when the RangeType.Days is selected |
| DisplayInDataBox | A bool indicating if the Chart’s Data Series value should display in the Chart’s Data Box |
| DisplayName | A string representing the Chart’s Data Series instrument and period |
| From | A DateTime representing the Chart’s Data Series configured “Start Date” when the RangeType.CustomRange is configured. |
| Instrument | A string representing the Chart’s Data Series instrument |
| IsStableSession | A bool indicating the Chart’s Data Series Break EOD option is configured |
| IsTickReplay | A bool indicating the Chart’s Data Series Tick Replay option is configured |
| Label | A string representing the configured Chart’s Data Series “Label” |
| LongExecutionBrush | A Brush object representing the Chart’s Data Series “Color for execution - buy” brush configured |
| PaintPriceMarker | A bool indicating the Chart’s Data Series Price Marker “Visible” option is configured |
| Panel | An int indicating which Chart’s Data Series “Panel” the ChartBars are configured |
| PlotExecutions | A ChartExecutionStyle enum representing “Plot executions” option. Possible values include: ChartExecutionStyle.DoNotPlot ChartExecutionStyle.MarkersOnly ChartExecutionStyle.TextAndMarker |
| PositionPenLoser | A Stroke object representing the Chart’s Data Series “NinjaScript strategy unprofitable trade line” |
| PositionPenWinner | A Stroke object representing the Chart’s Data Series “NinjaScript strategy profitable trade line” |
| PriceMarker | A PriceMarker object representing various brushes used to paint the Chart’s Data Series “Price marker” |
| RangeType | A RangeType enum indicating the “Load data based on” value configured on the Data Series. Possible values include: RangeType.Bars RangeType.Days RangeType.CustomRange |
| ScaleJustification | A ScaleJustification enum indicating the “Scale justification” option configured on the Chart’s Data Series. Possible values include: ScaleJustification.Right ScaleJustification.Left ScaleJustification.Overlay |
| ShortExecutionBrush | A Brush object representing the Chart’s Data Series “Color for execution - sell” brush configured |
| ShowGlobalDrawObjects | A bool indicating the Chart’s Data Series “Show global draw object” option is configured |
| To | A DateTime representing the configured “End Date” used with any RangeType |
| TradingHoursBreakLine | A TradingHoursBreakLine object representing the stroke used and TradingHoursBreakLineVisible enum used for the Chart’s Data Series “Trading hours break line”. Possible TradingHoursBreakLine.TradingHoursBreakLineVisible values include: TradingHoursBreakLineVisible.AllSessions TradingHoursBreakLineVisible.EodOnly TradingHoursBreakLineVisible.Off |
| TradingHoursData | A string representing the Chart’s Data Series configured “Trading hours” option |