Properties

View as Markdown

Definition

Represents a number of properties available to the Chart Scale which can be configured to change the appearance of the scale.
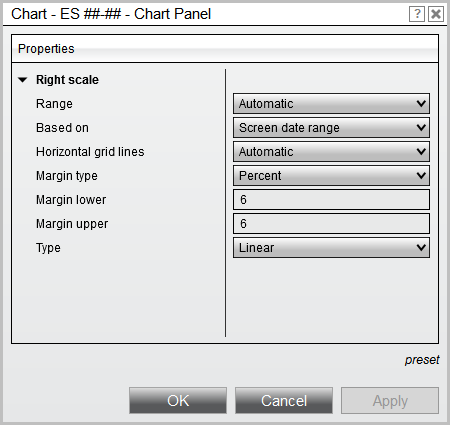
ChartPanel_Properites

These are UI properties which are designed to be set by a user. Attempting to modify these values through a custom script is NOT guaranteed to take effect.

Property Values

PropertyDescription
YAxisRangeTypeAn YAxisRangeType enum, possible values are:
• Automatic
• Fixed
AutoScaleDateRangeTypeAn AutoScaleDateRangeType enum, possible values are:
• ScreenDateRange
• EntireDateRangeSeriesOnly
HorizontalGridlinesCalculationAn YAxisRangeType enum, possible values are:
• Automatic
• Fixed
HorizontalGridlinesIntervalTypeA HorizontalGridlinesIntervalType enum, possible values are:
• Ticks
• Points
• Pips
HorizontalGridlinesIntervalA double value representing the vertical interval of the horizontal axis
AutoScaleMarginTypeAn AutoScaleMarginType enum, possible values are:
• Percent
• Price
AutoScaleMarginLowerA double value representing the lowest margin used for the chart scale
AutoScaleMarginUpperA double value representing the highest margin used for the chart scale
YAxisScalingTypeAn YAxisScalingType enum, possible values are:
• Linear
• Logarithmic
FixedScaleMaxA double representing the highest series value used for the chart scale when the scale is fixed
FixedScaleMinA double representing the lowest series value used for the chart scale when the scale is fixed

Syntax

\<chartscale\>.Properties

Examples

1protected override void OnRender(ChartControl chartControl, ChartScale chartScale)
2{
3 if (chartScale.Properties.YAxisScalingType == AxisScalingTypeLinear)
4 {
5 // do something
6 }
7}